Risk. It’s not rocket science, but it might just as well be, given how badly it is managed in most organisations. We’re talking about another key difference between Red World and Green World here. The difference between Operational Excellence thinking and the Innovator’s Mindset. The difference between systems at the mature end of their S-curve and those still at the beginning. The difference between working assumptions that glasses are half full or half empty.
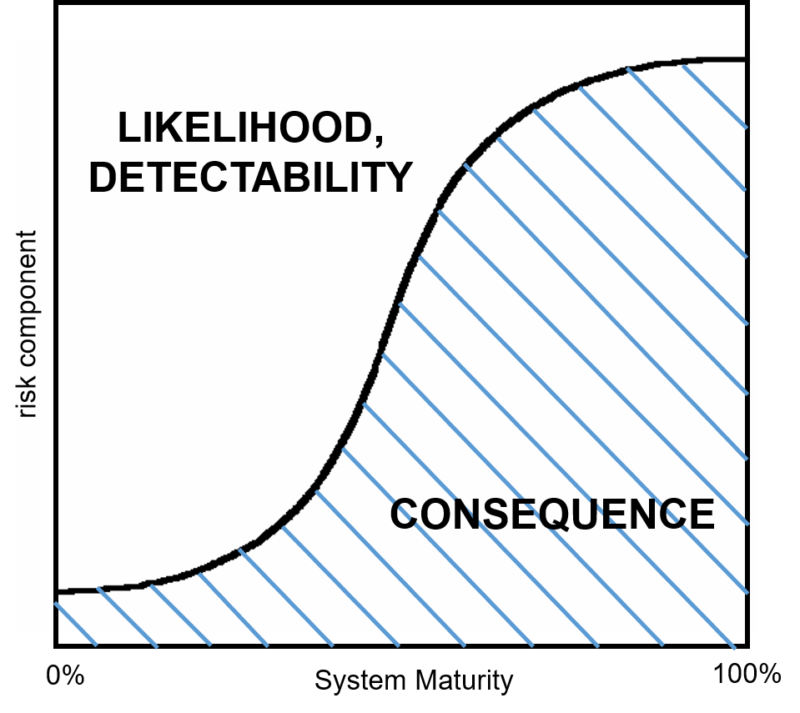
There are various ways to calculate risk, but likely the most effective one incorporates measures of the likelihood of an event happening, the consequences if it does, and the difficulty of detecting the arrival of the event. The level of these three factors changes quite significantly as a system travels along its s-curve. The general pattern looks something like this:

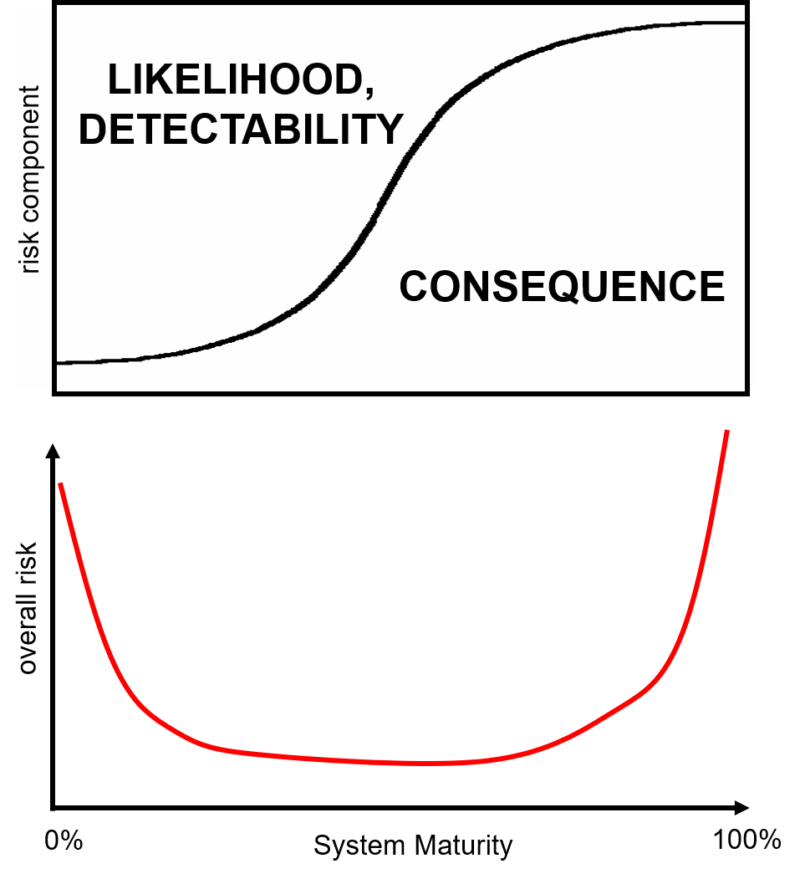
At the immature end of the s-curve the likelihood and detectability of risk events tend to be at their highest, while the consequences are at their lowest. Then, as a system matures, the situations get reversed, such that, by the time the system has plateaued at the top of the curve and all of the associated operational excellence related checks and balances are in place, the likelihood of adverse events has reached a minimum and there are procedures in place to track and trace all the myriad ‘known knowns’. The converse problem is that the few remaining ‘unknowns’ (think ‘black swans’) become progressively more difficult to detect, and at the same time, because the system has been optimised to the end of a dead-end road, the consequences when something does go wrong are potentially catastrophic.
We could see this vividly in mature, top-of-s-curve, operationally excellent enterprises deploying just-in-time supply chains at the start of the Covid-19 pandemic. We can also see it in society at large, where we also have a global ‘system’ at the top of its s-curve.
The problem at both ends of this size spectrum is ultimately the same: that the overall risk, when we integrate likelihood, consequence and detectability together gives a classic bath-tub curve profile. Something like this:

Which is probably another reason why this is the time for innovation. Or, better yet, systematic innovation.
